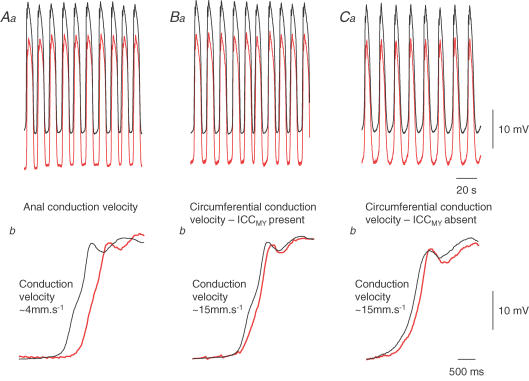
Figure 3. Conduction velocities of slow waves in the anal direction and in the circumferential direction, with ICCMY present and removed.
Upper left hand pair of traces (Aa) shows slow waves recorded simultaneously from the greater curvature of an antral preparation attached to the corpus. The electrodes were separated by 2 mm with the lower recording (red trace) having a more anal location. Expansions of these traces (Ab) show that slow waves were first detected by the electrode nearer the corpus and rising phases were separated by ∼500 ms, giving a conduction velocity of ∼4 mm s−1. Upper central pair of traces (Ba) shows slow waves recorded from antral preparation, attached to the corpus, with intact ICCMY network; electrode separation 2 mm with lower recording (red trace) being circumferentially located. Expansions (Bb) show that slow waves were first detected near the greater curvature and rising phases were separated by ∼140 ms, giving a conduction velocity of ∼15 mm s−1. The upper left hand pair of traces (Ca) show simultaneous recordings of slow waves from an antral preparation attached to the corpus in a region from which ICCMY network had been dissected away; electrode separation 2 mm with the lower recording (red trace) circumferentially located. Expansions (Cb) show that slow waves were again first detected near the greater curvature and the conduction velocity was again ∼15 mm s−1. The upper time calibration bar applies to traces Aa, Ba and Ca: The lower time calibration bar applies to traces Ab, Bb and Cb. Traces modified from Hirst et al. (2006).

