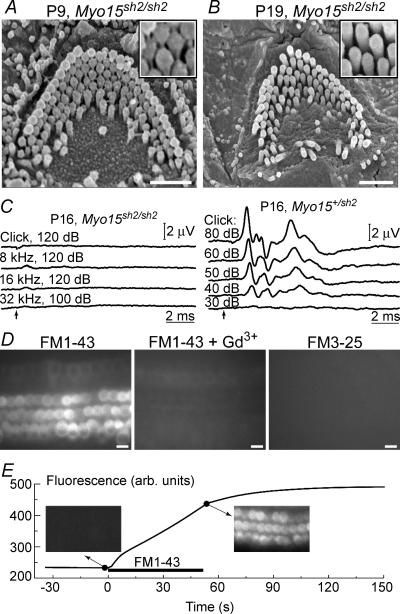
Figure 1. Auditory mechanotransduction phenotype of young postnatal Myo15sh2/sh2 mice.
A and B, SEM images of Myo15sh2/sh2 OHCs at postnatal day 9 (P9) (A) and 19 (B). Insets show magnified images of stereocilia. Note stereocilia links in A and their absence in B. C, auditory brainstem responses in P16 homozygous (left) and heterozygous (right) Myo15sh2 mice. Stimulus type and intensity (dB SPL, sound pressure level) are indicated. Arrows mark the stimulus onset. D, epifluorescent images of Myo15sh2/sh2 organ of Corti explants (harvested at P3 and kept 3 days in vitro) after incubations with 5 μm FM1-43 for 60 s (left), FM1-43 and 1 mm GdCl3 for 60 s (middle), or FM3-25 for 6 min (right). E, time course of FM1-43 uptake in Myo15sh2/sh2 hair cells measured at the confocal optical plane below the cuticular plate. Insets show the actual fluorescent images before and immediately after application of 5 μm of the dye to the apical surface of OHCs. Scale bars: 1 μm (A, B); 10 μm (D). All cells (A and B, D and E) were located approximately at the end of the first (apical) cochlear turn.

