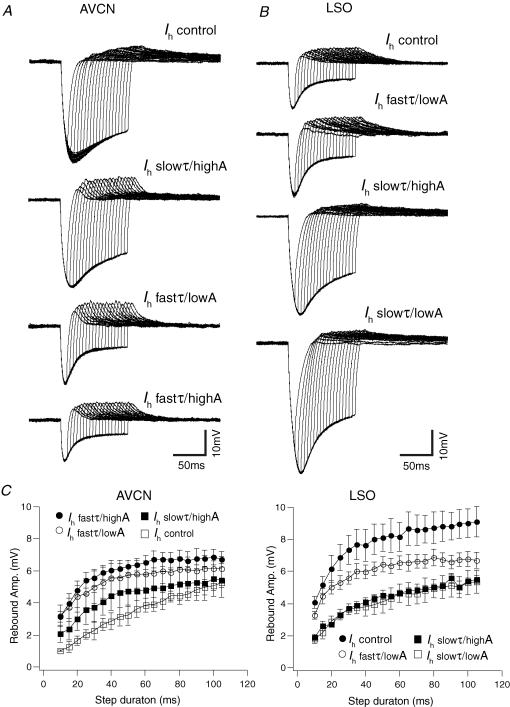
Figure 5. Rebound depolarization shows different dependency on Ih in AVCN and LSO cells.
A, example of an AVCN bushy cell response to −300 pA hyperpolarizing current steps of various durations (10–105 ms, 5 ms increments) after different Ih properties had been applied by dynamic clamp to the same neuron. B, example of a SF LSO neuron voltage response to hyperpolarizing current steps (same as in A) with different Ih properties. C, summary of current step (−300 pA) duration versus rebound depolarization amplitude relationships for AVCN bushy cells and LSO principal neurons (data presented as mean ± s.e.m.) after different Ih properties had been applied by dynamic clamp.

