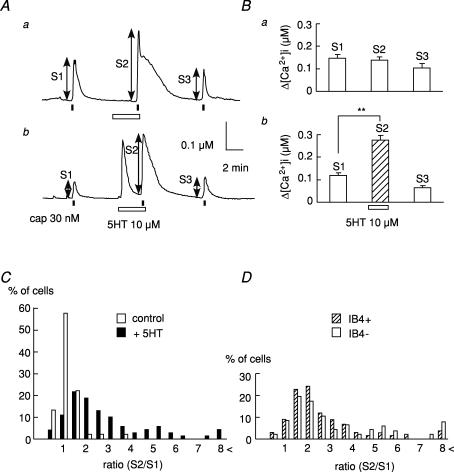
Figure 1. Potentiating effects of 5-HT on the [Ca2+]i responses to capsaicin.
A, representative [Ca2+]i increases induced by capsaicin (cap, 30 nm) before, during the application of 5-HT (10 μm), and after its removal. 5-HT failed to produce a [Ca2+]i increase in the majority of cells (a), but in some cells, 5-HT elicited a [Ca2+]i increase (b). B, summarized data on changes in the [Ca2+]i increase induced by capsaicin before (S1), without (a) or with (b) 5-HT (S2) and after its washout of 5-HT (S3). The increment of [Ca2+]i (Δ[Ca2+]i) shown by the double-ended arrows was plotted (control, n = 89, N = 4; +5-HT, n = 231, N = 5). ** P < 0.01. C, histogram showing the percentage of cells versus the ratio (S2/S1) of the capsaicin-induced [Ca2+]i increase. In the control, data were obtained from the 3 repeated applications of capsaicin without 5-HT. D, histogram showing the percentage of cells–S2/S1 ratio relation for IB4-positive (IB4+; n = 129, N = 5) and -negative neurons (IB4−; n = 102, N = 5) in the presence of 5-HT. These data were transcribed from C (+5-HT) after sorting cells by the differences in IB4 staining.

