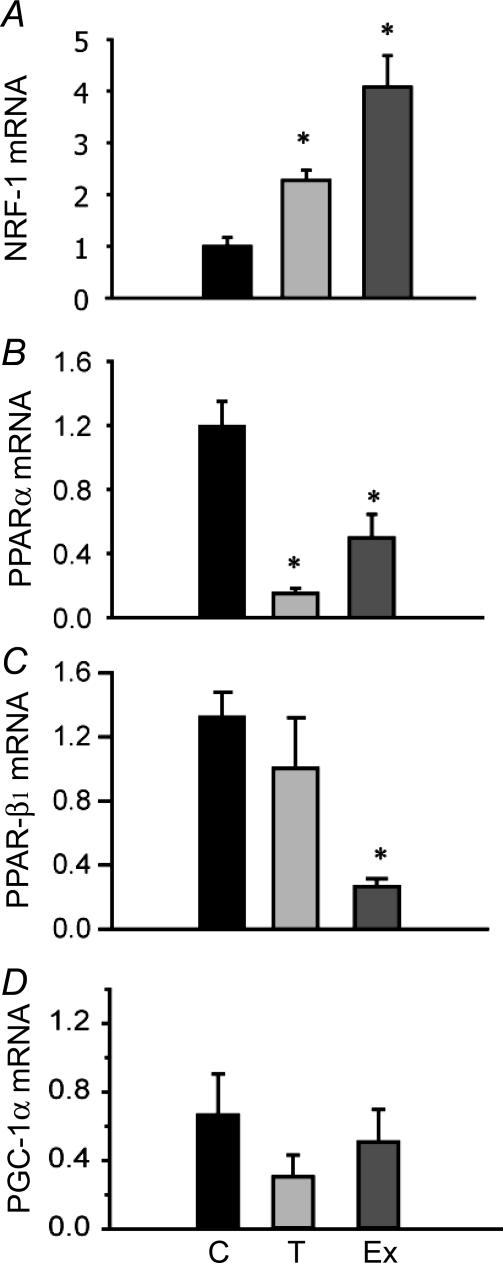
Figure 4. Gene expression levels (mRNA) for transcription factors: nuclear respiratory factor (NRF)-1 (A), peroxisome proliferator activator receptor (PPAR)-α (B), PPAR-β1 (C) and PPAR-γ cofactor (PGC)-1α (D) in adult zebrafish exposed to cold temperatures (18°C, T) for 4 weeks and exercise trained for 4 weeks (Ex), compared to 28°C controls.
Expression levels were measured by real-time PCR using SYBR green. Results are relative to a randomly selected control sample and normalized to β-actin. n= 5 for all except PCG-1α (n= 6). *Significantly different from control (P < 0.05). Error bars represent s.e.m.

