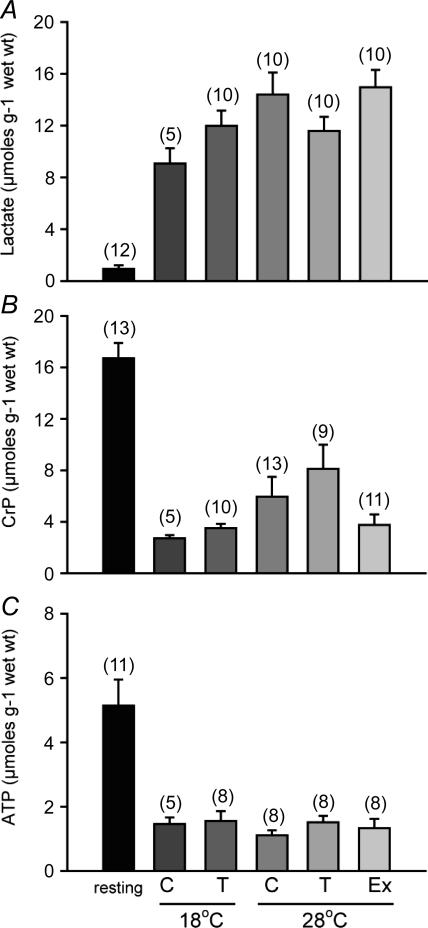
Figure 6. Mixed muscle concentrations of A, lactate (A), phosphocreatine (B) and ATP in μmol (g wet weight)−1 (C).
Resting values from 28°C controls are compared to fatigue values at the end of the critical swimming (Ucrit) tests at 18°C and 28°C in adult zebrafish exposed to cold temperatures (18°C, T) for 4 weeks and exercise trained for 4 weeks (Ex), compared to controls (C). Samples sizes appear above each bar. All post-exercise data are significantly different from resting controls. #Significantly different from T exercised at 28°C. Error bars represent s.e.m.

