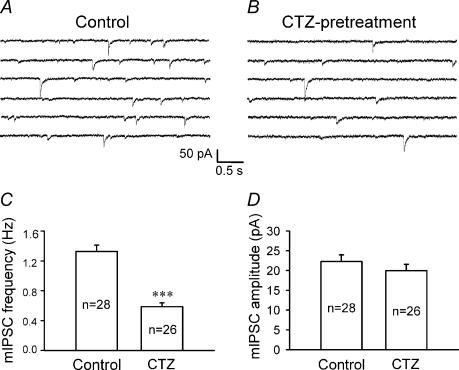
Figure 2. Chronic CTZ treatment results in a significant decrease of the frequency but not the amplitude of miniature IPSCs.
A and B, consecutive current traces illustrating mIPSCs recorded in the presence of TTX (0.5 μm) and CNQX (20 μm) in control (A) and CTZ-pretreated (B) neurons. The frequency of mIPSCs was considerably lower in CTZ-pretreated neurons. Throughout the experiments, holding potential =−70 mV. C, bar graphs showing that the average mIPSC frequency was significantly decreased after CTZ pretreatment (control, 1.33 ± 0.09 Hz; CTZ pretreatment, 0.59 ± 0.05 Hz; ***P < 0.001). D, bar graphs showing that the average mIPSC amplitude was similar between control (22.3 ± 1.7 pA) and after CTZ pretreatment (20.0 ± 1.6 pA; P > 0.3).

