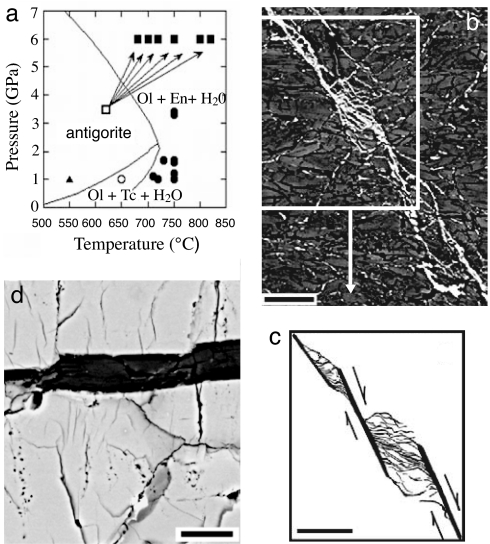
Fig. 2.
Serpentine faulting experiments. (a) Phase diagram showing stability field of antigorite serpentine and its break-down products. Circles, squares, and triangle show experimental conditions of ref. 4. (b) En echelon faults and anticracks decorated by solid reaction products (bright) in dark antigorite matrix. (c) Sketch illustrating fault segments (heavy lines) and anticracks (light, wavy lines). (d) Region of relict olivine with antigorite inclusion showing mode I cracks produced during dehydration of antigorite; several early formed cracks are marked only by arrays of water bubbles after crack healing. Modified after ref. 4. (Scale bars: 20 μm.)

