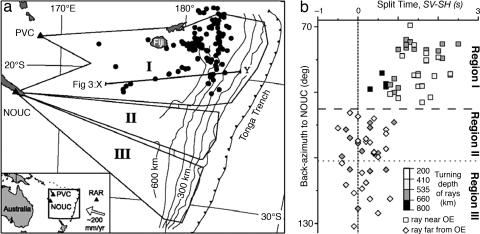
Fig. 5.
Mapped areas of petrologic anomaly in mantle transition zone beneath Fiji showing anisotropy only where earthquakes are occurring (a). Black dots in sector I show hypocenters of outboard earthquakes; sector II has markedly higher seismic velocities in transition zone that slow to the south; sector III is normal mantle transition zone. (b) Shear-wave splitting measurements. Note that anisotropy ends abruptly at the boundary between sectors I and II, coincident with jump in seismic velocities and cessation of earthquakes. [Reproduced with permission from ref. 27 (Copyright 2003, American Geophysical Union).]

