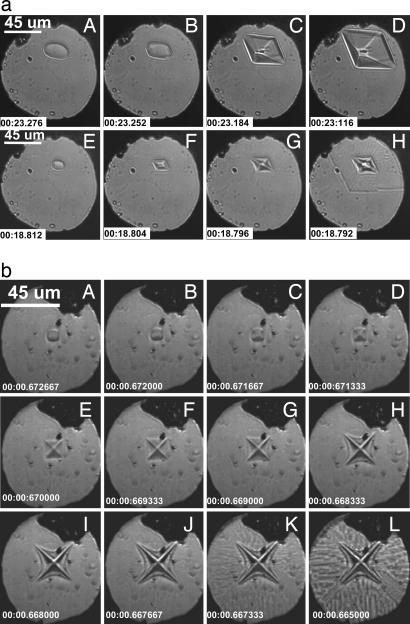
Fig. 2.
High-speed optical microscope images of ice VI crystal in d-DAC. (a) Sequence of the crystal growth under trapezoidal compression (see Fig. 4). The images (A–H) were obtained at the ramping times (or the compression rates) 550 ms (0.89 s−1) and 150 ms (3.28 s−1), with the piezo input pulses (I and III) in Fig. 4. The recording rate of the camera was 250 frames per s with a 1,024 × 1,024-pixel resolution. Ruby chips are indicated by small black spots. The corresponding changes in crystal size and growth speed appear in Fig. 3 a and b. (b) Dendritic ice VI in d-DAC, showing the sequence of crystal growth in response to sinusoidal compression [28 Hz; average (Δl/l)/Δt = 136.13 s−1]. The recording rate was 3,000 frames per s with 1,024 × 1,024 pixels. The corresponding changes in crystal size and growth speed appear in Fig. 3 c and d.

