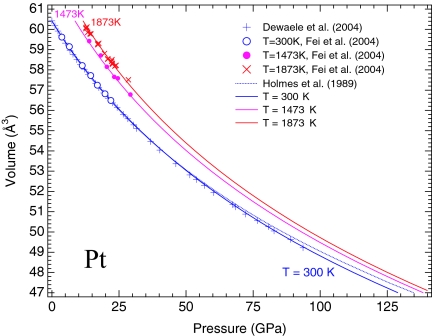
Fig. 2.
Calculated isothermal compression curves of Pt at 300, 1,473, and 1,873 K, compared with experimental data. The 300-K data of Fei et al. (18) (open circles) and Dewaele et al. (11) (crosses) are based on the Au scale of this study and the ruby scale of Dewaele et al. (11), respectively. The Pt scales of Holmes et al. (4) (the dotted curve) systematically overestimate pressures at room temperature. The filled circles and red crosses represent experimental data of Fei et al. (18) at 1,473 and 1,873 K, respectively. The pressures of these data were recalculated by using the Au scale of this study.

