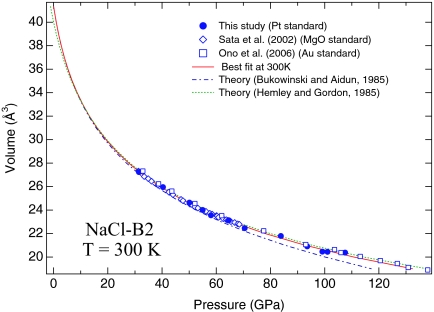
Fig. 3.
Pressure–volume relationship of the NaCl-B2 phase at 300 K. The solid curve represents the best fit to the experimental data of this study. The dashed–dotted and dotted curves represent theoretical calculations by Bukuwinski and Aidun (42) and Hemley and Gordon (43), respectively. The experimental data of Sata et al. (37) (open diamonds), Ono et al. (38) (open squares), and this study (filled circles) are based on the MgO scale of Speziale et al. (33) and the Au and Pt scales of this study, respectively.

