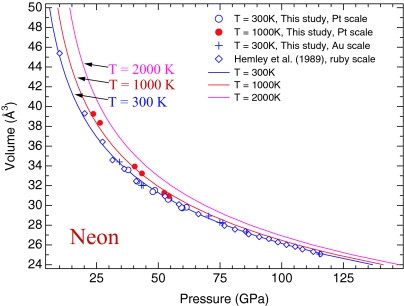
Fig. 5.
Calculated isothermal compression curves of solid Ne at 300, 1,000, and 2,000 K, compared with experimental data. The 300-K experimental data of this study (open circles, the Pt scale; crosses, the Au scale) and Hemley et al. (45) (open diamonds, the ruby scale) are in a good agreement. The pressures of the Hemley data (45) are recalculated based on the new ruby scale (11), which are more consistent with the W pressure scale. The filled circles represent compression data at 1,000 K, based on the Pt scale of this study.

