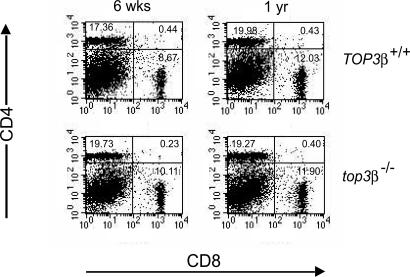
Fig. 2.
Unchanged proportion of CD4+ and CD8+ T cells in top3β−/− mice. Splenocytes of groups of TOP3β+/+ and top3β−/− mice 6 weeks and 1 year of age were first treated with FITC-tagged antibodies against CD4 and PE-tagged antibodies against CD8, and then analyzed by flow cytometry. For each group, data from sorting of cells from three mice were combined and displayed. The calculated percentage of each cell population is shown in the corresponding quadrant of the figure. All mice in this experiment exhibited no apparent sign of disease.

