Fig. 2.
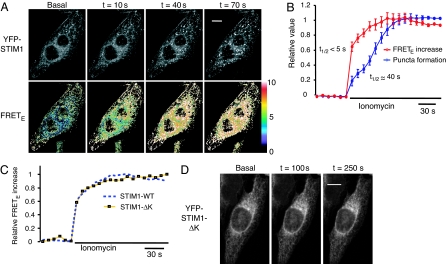
STIM1 oligomerization and translocation to ER–PM junctions are sequential processes. (A) YFP and FRETE images of a YFP-STIM1 and CFP-STIM1 coexpressing HeLa cell acquired near the adhesion surface after 10 μM ionomycin stimulation in a Ca2+-free buffer. (Scale bar, 20 μm.) (B) A kinetic comparison of STIM1 FRETE increases and puncta formation in the same cells. The average FRETE responses of 28 ionomycin-stimulated cells are shown. STIM1 puncta formation was monitored in these cells by measuring the average granule intensity in each cell by using a Gaussian filter (see Materials and Methods). SEs are shown. (C) The average FRETE trace of 29 CFP-STIM1-ΔK and YFP-STIM1-ΔK cotransfected HeLa cells was compared with the wild-type STIM1 FRETE trace shown in B. (D) Confocal images of a YFP-STIM1-ΔK transfected HeLa cell acquired near the adhesion surface after 10 μM ionomycin stimulation in a Ca2+-free buffer. There was no puncta formation in all ionomycin-stimulated YFP-STIM1-ΔK-transfected HeLa cells examined (>100 cells from 30 experiments). (Scale bar, 20 μm.)

