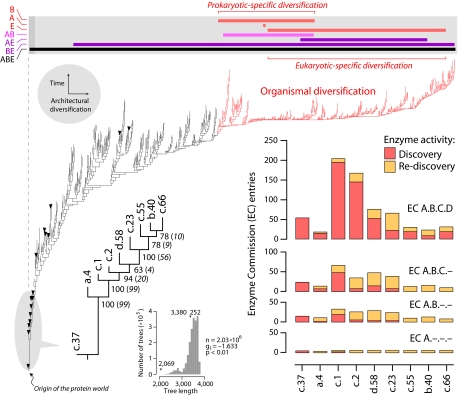
Fig. 1.
Metabolism and the protein world. Reconstruction of a phylogenomic tree of protein fold architecture using data from a domain census in 185 fully sequenced genomes representing the three superkingdoms of life (15). One optimal most-parsimonious tree [85,644 steps; consistency index (CI) = 0.043; retention index (RI) = 0.770; length skewness (g1) = −0.136; permutation tail probability (PTP) test, P = 0.01] was recovered after a heuristic search with tree-bisection-reconnection branch swapping and 100 replicates of random addition sequence. Phylogenetically uninformative characters were excluded from the analysis. To decrease search times during branch swapping of suboptimal trees, no more than one tree was saved in each replicate. The tree depicted evolutionary relationships of 776 SCOP folds, was well resolved, had strong cladistic structure (P < 0.01), and was consistent with phylogenies generated from a set of 32 proteomes using a similar approach (13). Bullets identify 16 folds shared by the genomes analyzed (c.37, a.4, c.1, c.2, d.58. c.23, c.55, b.40, c.66, c.47, d.15, a.2, d.142, b.34, a.5, and c.120, from ancestral to derived; see SI Fig. 6 for fold names). All other terminal leaves are unlabeled because they would not be legible. A phylogenomic tree of the nine most ancient and widely shared folds identified in the global tree is described separately. An exhaustive maximum parsimony search resulted in one tree of 2,069 steps (CI = 0.687, RI = 0.728) that was well supported by bootstrap support (BS) values (shown below nodes) and decay indices (in parentheses) and measures of skewness in tree distribution (see Inset; PTP test, P = 0.01). Enzymatic activities associated with these nine ancestral folds were retrieved from MANET. These activities describe variability in reaction chemistry, indicating number of EC entries defined at the four different levels of classifications: class (A, one of six general enzyme categories), subclass (B, denoting type of chemical compound or group involved in the reaction), subsubclass (C, describing the type of reaction), and serial identifier (D, identification of individual enzymes). Discovered and rediscovered enzymatic activities are plotted in bar diagrams. The bar diagram above the universal tree shows range of distribution of folds unique to Archaea (A), Bacteria (B), and Eukarya (E) in the tree (red bars), those folds shared by prokaryotes (pink bar) and by other superkingdoms. The upper bound for organismal diversification is shown by coloring tree branches in red.

