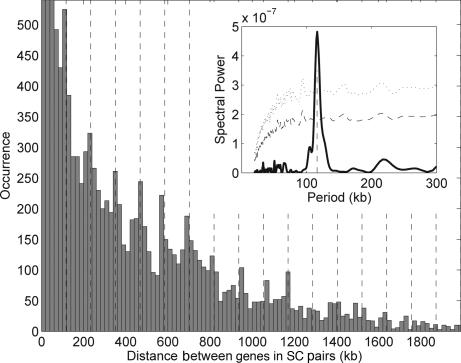
Fig. 2.
Distributions of distances between SC paired genes in the E. coli genome. The distribution displays periodic peaks, indicating a preferred chromosomal distance (≈117 kb) between genes belonging to an SC pair. A 117-kb spaced grid is overlapped with the histogram. The first three peaks, cut for visualization purposes, reach the values of 628, 649, and 645, respectively. (Inset) Discrete Fourier transform analysis of the distribution, displaying a major 117-kb peak (dashed vertical line). Statistical significance lines are plotted at 3σ (dashed line) and 5σ (dotted line) from the mean of 10,000 randomizations.

