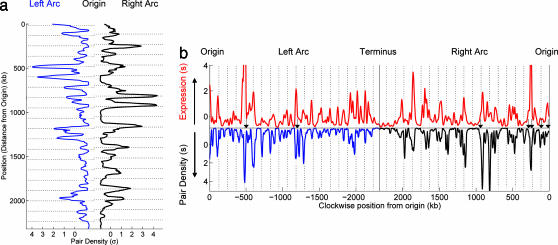
Fig. 3.
Distributions of pair density along chromosomal arcs, and correlation with expression. (a) Density of the SC paired genes along the chromosome. The distance from the central axis reflects the number of times a gene at this position is in an SC pair with another gene, i.e., the total number of pairs involving this position. The distributions for the right arc (black) and for the left arc (blue) are placed facing each other to emphasize the symmetry. Prominent peaks occur preferentially in phase with the 117-kb spaced grid (horizontal lines, P = 0.012; see SI Fig. 8). (b) Comparison of transcription level with pair density along the chromosome. Absolute expression level (red, on top) during log phase growth is plotted as a function of chromosomal position. Expression is compared with pair density (bottom distribution) along the left (blue) and right (black) arcs of the chromosome. Distance above the horizontal indicates increasing expression and below the horizontal indicates increasing pair density (in units of σ). Many of the highest peaks in the transcription profile fall near the 117-kb grid lines defined by the SC pairs. In addition, the locations of six of the seven rRNA operons (black arrows) fit this same grid (P = 0.054, calculated as for the SC pair density grid fit, by using 1,000 randomization of the rRNA operon positions). Note that the rRNA positions were not included in the pair selection because of their multiplicity in many genomes and were not included in the transcription profile because of their high transcript levels.

