Fig. 3.
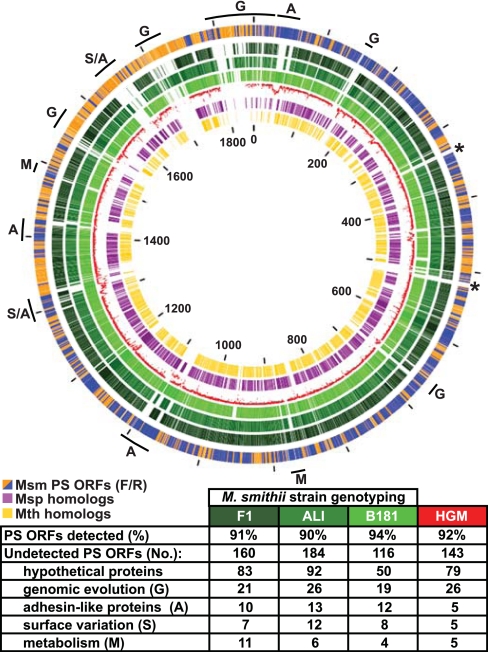
Analysis of the M. smithii pan-genome. Schematic depiction of the conservation of M. smithii PS genes [depicted in the outermost circle where the color code is orange for forward strand ORFs (F) and blue for reverse strand ORFs (R)] in (i) other M. smithii strains (GeneChip-based genotyping of strains F1, ALI, and B181; circles in increasingly lighter shades of green, respectively; see SI Table 2 for details), (ii) the fecal microbiomes of two healthy individuals [human gut microbiome (HGM), shown as the red plot in the fifth innermost circle with nucleotide identity plotted from 80% (closest to the purple circle) to 100% (closest to lightest green ring); see also SI Fig. 9 for details], and (iii) two other members of the Methanobacteriales division [M. stadtmanae (Msp) (purple circle), another human gut methanogen, and M. thermoautotrophicus (Mth) (yellow circle), an environmental thermophile; mutual best BLASTP hits (E value <10−20)]. Tick marks indicate nucleotide number in kilobases. Asterisks denote the positions of ribosomal rRNA operons. Letters highlight distinguishing features among M. smithii genomes: the table below the figure summarizes differences in M. smithii gene content between strains F1, ALI, and B181, as well as the two human fecal metagenomic data sets.

