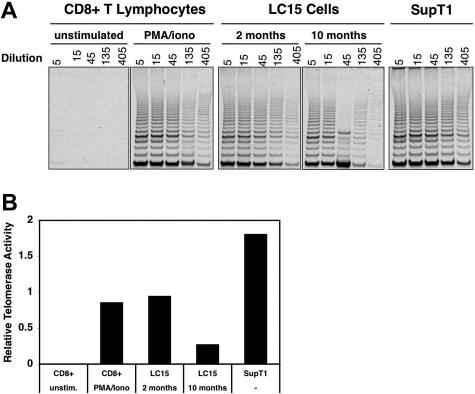
Figure 6.
Comparison of telomerase activity in various cell types. (A) Telomerase activity was evaluated in CD8+ T cells, LC15 cells, and the SupT1 lymphoblast line. Naive CD8+ T cells were analyzed directly or after stimulation with 2 nM PMA and 100 nM ionomycin for 4 days. LC15 cells were analyzed 2 months and 10 months after IL-2 withdrawal. Nuclear extracts were obtained from all cell cultures and serially diluted; these samples were then subjected to the Telomeric Repeat Amplification Protocol (TRAP) assay, and the products were visualized by agarose gel electrophoresis. Extracts divided into aliquots from the EL-4 cell line were used as an interexperimental control (not shown). (B) For each set of reactions, telomerase activity was determined by measuring the image intensity with a phosphor imager and dividing this value by the intensity of an internal PCR standard (not shown).

