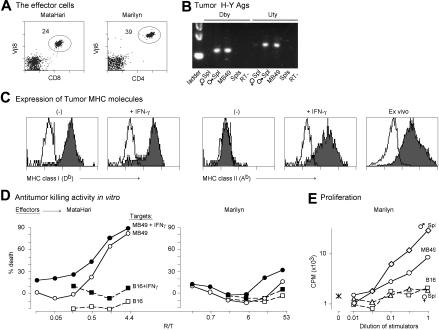
Figure 1.
In vitro characterization of the MataHari and Marilyn T cells and the MB49 tumor. (A) TCR, CD8, and CD4 expression of MataHari (Vβ8) and Marilyn (Vβ6) T cells. Numbers represent the percentage of transgenic cells in the mixed population of spleen and mesenteric lymph node cells used in the adoptive transfer experiments. (B) H-Y expression of the MB49 tumor. PCR using specific primers for the sequences of Dby and Uty that code for the peptide epitopes seen by Marilyn and MataHari, respectively. Spleens from female and male B6 mice were used as negative and positive controls. (C) Expression of MHC Class I (Db) and MHC Class II (Ab) by in vitro-grown MB49 tumor cells that were either untreated (−) or incubated for 2 days with 500 IU/mL of IFN-γ (+IFN-γ) or by tumor cells growing subcutaneously in a female B6 mouse, 7 days after inoculation (ex vivo). Unshaded area is staining seen with a control antibody (specific for Kd.) (D) In vitro antitumor activity. Eighteen-hour JAM test to measure killing activity of MataHari cells (left panel) or Marilyn cells (right panel) against MB49 (circles) or B16 (squares) tumor targets that had been incubated with IFN-γ as in C (filled symbols) or not (open symbols). R/T = responder to target ratio. (E) Proliferation of Marilyn CD4 cells in vitro. Proliferation of Marilyn cells either alone (asterisk) or in presence of mitomycin treated MB49 (circles), B16 (squares), male spleen (diamonds), or female spleen (triangles) as described in “Materials and methods.” The highest number of stimulators were 1.5 × 10⁴ for the tumor cells and 5 × 10⁵ for the splenocytes. D and E show one experiment that is representative of 3.

