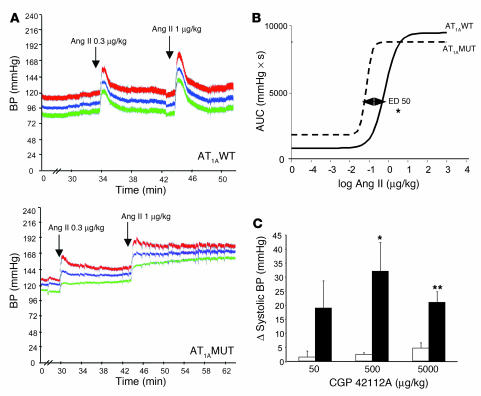
Figure 4. Pressor response to Ang II of AT1AWT and AT1AMUT mice.
Effect of cumulative intravenous bolus doses of Ang II on BP in anesthetized mice. (A) Representative recordings, following Ang II injections (arrows), of systolic (red), mean (blue), and diastolic (green) BPs in AT1AWT and AT1AMUT mice. After each Ang II dose, BP stabilized at a significantly higher level in AT1AMUT mice than in control mice. (B) Ang II dose-response effect on systolic BP. The area under the curve (AUC; see Methods) was measured for each Ang II dose in AT1AWT (solid line) and AT1AMUT mice (dotted line). (C) Systolic BP response to increasing bolus doses of CGP42112A injected in anesthetized AT1AWT (white bars) and AT1AMUT (black bars) mice. *P < 0.05, **P < 0.01 compared with AT1AWT.

