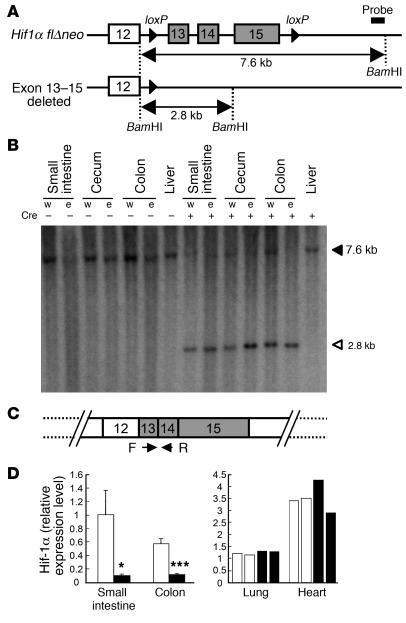
Figure 2. Intestinal epithelium–specific disruption of Hif1a gene.
(A) Schematic structure of the modified Hif1a allele. The probe used in the Southern blot analysis is indicated. (B) Southern blot analysis for the Hif1a allele. Filled and open triangles indicate Hif1a flΔneo and exon 13–15–deleted allele, respectively (18). Fragments corresponding to the Hif1a flΔneo allele were only detected in Hif-1αΔIE mice. w, whole tissue; e, epithelial cells. (C) Primers used for the detection of intact Hif1a transcripts. (D) Relative expression levels of the intact Hif1a transcripts measured by qPCR. White and black bars represent the Hif-1αF/F and Hif-1αΔIE mice, respectively. Average values for 4 mice (for intestine) or individual values in 2 mice (for lung and heart) in each group are shown. Relative values were calculated from the average expression level in the small intestine of the Hif-1αF/F mice defined as standard (set as 1.0). Error bars indicate SEM. Statistical significance between the average of Hif-1αF/F and Hif-1αΔIE mice in the same tissue was examined. *P < 0.05; ***P < 0.001.

