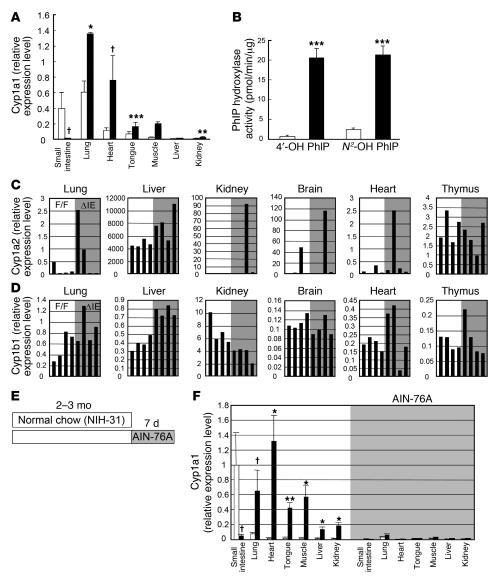
Figure 4. Genetic background independency, gene selectivity, and dietary factor dependency of the extra-gut P450 induction in ArntΔIE mice.
(A) Cyp1a1 expression levels in ArntF/F and ArntΔIE mice on the C57BL/6N background. Average values for each group (n = 4) are shown. White and black bars represent the expression levels in ArntF/F and ArntΔIE mice, respectively. (B) PhIP hydroxylase activities of lung microsomes isolated from ArntF/F and ArntΔIE mice on the C57BL/6N background. Average values for each group (n = 4) are shown. White and black bars represent the expression levels in ArntF/F and ArntΔIE mice, respectively. (C and D) mRNA expression levels of Cyp1a2 (C) and Cyp1b1 (D) in ArntF/F and ArntΔIE mice. Each bar corresponds to an individual animal. F/F, ArntF/F (open); ΔIE, ArntΔIE (shaded). (E) Diet administration scheme. (F) Cyp1a1 mRNA expression levels before (white) and after (shaded) the administration of the purified diet. Average values for each group (n = 3–4) are shown. mRNA expression levels were determined by qPCR. Relative values for each gene were calculated from the average expression level in the small intestine of the ArntF/F mice on the FVB/N background defined as general standard (set as 1.0). Error bars indicate SEM. Statistical significance between the average values for ArntF/F and ArntΔIE mice in the same tissue under the same dietary conditions was examined. *P < 0.05; †P < 0.05; **P < 0.005; ***P < 0.001.

