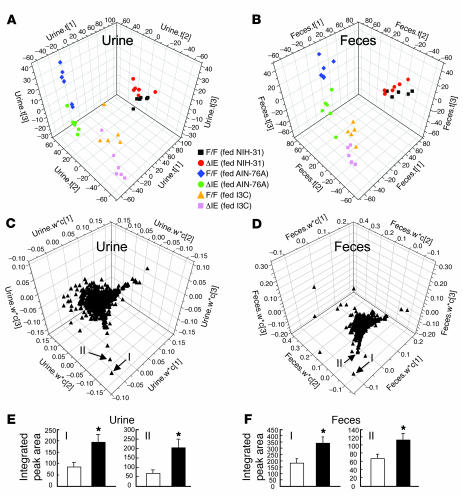
Figure 6. Metabolomic analysis of urine and fecal extracts from I3C-fed animals.
The results of PLS-DA for urine and fecal extracts. Three components were assigned to build up these models by SIMCA-P+ 11 software in each case. (A) The 3D scores scatter plots for urine. Individual samples are scattered depending on their compositions. The t[1], t[2], and t[3] values represent the contribution scores of each sample in components 1, 2, 3, respectively. Corresponding symbols and colors for the genotype and dietary conditions of each sample are indicated. F/F, ArntF/F; ΔIE, ArntΔIE. (B) The 3D scores scatter plots for fecal extracts. (C) The 3D loading scatter plots for urine. Each triangle indicates an individual ion distributed depending on its contribution to each component. The w*c[1], w*c[2], and w*c[3] values represent the contribution scores of each ion for components 1, 2, and 3, respectively. (D) The 3D loading scatter plots for fecal extracts. I: ion with m/z 130+ and retention time approximately 4.8 minutes; II: ion with m/z 334+ and retention time approximately min. Average integrated peak areas for ions I and II in urine (E) and fecal extracts (F) are also shown. White and black bars represent the values in ArntF/F and ArntΔIE mice, respectively. Five to 6 mice per each group were examined. Error bars indicate SEM. Statistical significance between the average values for ArntF/F and ArntΔIE mice in the same sort of samples under the same dietary conditions was examined. *P < 0.05.

