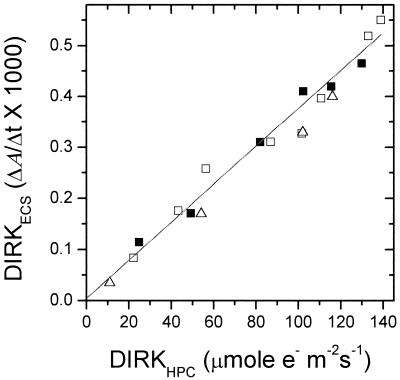
Figure 4.
Comparison of DIRKECS, estimating proton pumping, and DIRKhpc., estimating electron flux through the cyt b6f complex and PSI. Values were calculated as described in the text and previously (29). The different symbols represent data taken from three separate plants. The r value of the best-fit line was 0.992.

