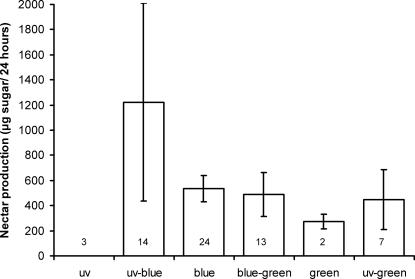
Figure 3. Nectar sugar production rates for plant species flowering, near Würzburg, during the period of bumblebee foraging performance experiments.
The 63 plant species included all flower during this period (June and/or July) according to published phenological data [29], and are divided into six bee-subjective colour categories (numbers associated with each column indicate the number of species flowering in each colour category). Flowers were protected from visitation with gauze for 3 hours after being emptied by a B. terrestris worker [17], [27]. After the 3 hour exclusion period, the nectar volume was quantified for 30–60 flowers per species: nectar concentration was measured with a pocket refractometer (Atago HSR-500, Atago Co. Ltd., Japan). Data given here are the mean (± 1 SE) amounts of sugar produced (µg in 24 hours) by species in each bee-subjective colour category.

