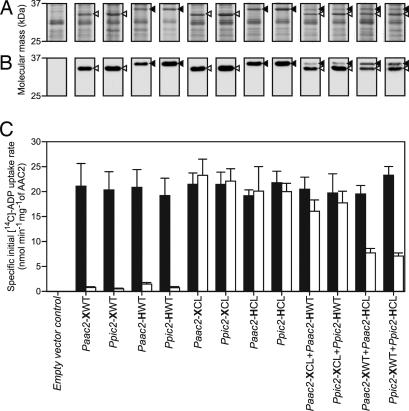
Fig. 2.
The transport activities in the presence and absence of MTSES of untagged and/or His-tagged AAC2 versions expressed individually or in combinations. (A) Coomassie blue-stained sodium-dodecylsulfate polyacrylamide gel of isolated mitochondrial membranes with ≈7.5 μg of protein loaded per lane. (B) Western blot of the same samples with α-AAC2 antibody with ≈0.75 μg of protein loaded per lane. Closed and open arrow heads indicate the positions of the His-tagged and untagged AAC2, respectively. (C) The effect of MTSES on the specific initial uptake rate of wild-type and cysteine-less AAC2, expressed individually or in combinations. The black and the white bars indicate the specific initial uptake rate in the absence and the presence of MTSES, respectively. Paac2 and Ppic2 are the promoters. X and H indicate untagged and His-tagged AAC2, respectively, and CL and WT indicate the cysteine-less and wild-type AAC2, respectively.

