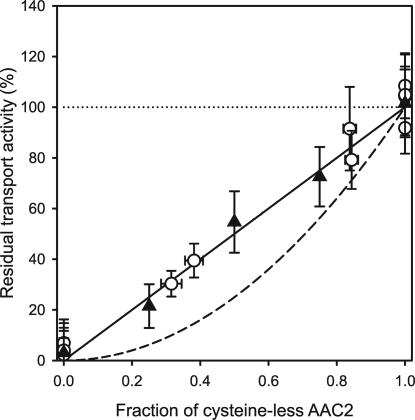
Fig. 3.
Correlation between the fraction of cysteine-less AAC2 and the residual initial transport rate after addition of MTSES. The residual initial transport rate in the presence of MTSES is expressed as a percentage of the rate in the absence of MTSES. Open circles represent the residual rate of coexpressed wild-type and/or cysteine-less AAC2 in mitochondrial membranes. The average rate in the absence of MTSES (100%, dotted line) was 20.6 ± 2.7 nmol·min−1·mg−1 of AAC2 (raw data from Fig. 2). The closed triangles indicate the residual transport rate of wild-type and/or cysteine-less AAC2, purified separately and mixed in defined molar ratios and then reconstituted into liposomes. In this case, the average rate was 16.4 ± 4.6 nmol·min−1·mg−1 of AAC2 in the absence of MTSES (100%, dotted line). The initial uptake rates of [14C]-ADP were determined in quintuplicate in the first 15 s of linear uptake. The amount of AAC2 in the fused mitochondrial membranes or proteoliposomes was quantified in triplicate by using Western blot analyses and known amounts of purified AAC2 as standard. The continuous and dashed lines represent the theoretical correlation for the independent and dependent functional interactions of the cysteine-less AAC2 and wild-type AAC2, respectively.

