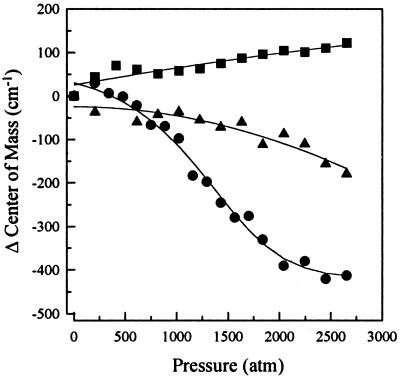
Figure 1.
Effects of specific and nonspecific DNA binding on pressure-induced dissociation of E2c. Spectral shift was measured as a function of hydrostatic pressure applied to 1.0 μM E2c alone (●), complexed to a specific DNA sequence (▪), E2-DBS (0.25 μM dimer–DNA complex), or to a nonspecific DNA sequence (▴), poly(A-T) 18-mer (0.25 μM dimer–DNA complex). The experiment was performed as described in Experimental Procedures. The solid line for dissociation of E2c alone represents the fitting obtained with Eq. 6. The lines represent second-order linear regressions. 1 atm = 0.101325 MPa.

