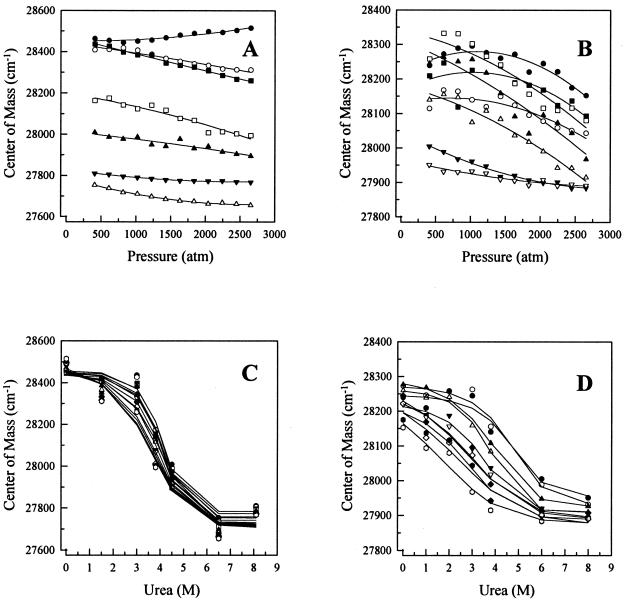
Figure 4.
Urea dependence of E2c spectral changes induced by high pressure.
High hydrostatic pressure was applied to samples containing 0.25 μM
(E2c–DNA) complex in the standard buffer at 25°C in the absence of
urea (●) or in the presence of: (A) 1.5 M
(○), 3 M (▪), 3.8 M (□), 4.5 M
(▴), 6.5 M (▵), or 8.1 M (▾) urea;
(B) 0.5 M (○), 1.0 M
(▪), 2.0 M (□), 3.0 M (▴), 3.8 M
(▵), 6.0 M (▾), or 8.0 M (▿) urea.
(A) E2-DBS; (B) poly(A-T) 18-mer. C
and D are replots of A and B,
respectively, as urea unfolding under different pressures: 408
(●), 610 (○), 815 (█), 1020
(□), 1220 (▴), 1430 (▵), 1630
(▾), 1840 (▿), 2040 (⧫), 2240 (⋄),
2450 ( ),
or 2653
(
 ) atm.
The curves were fitted for Eq. 8.

