Figure 5.
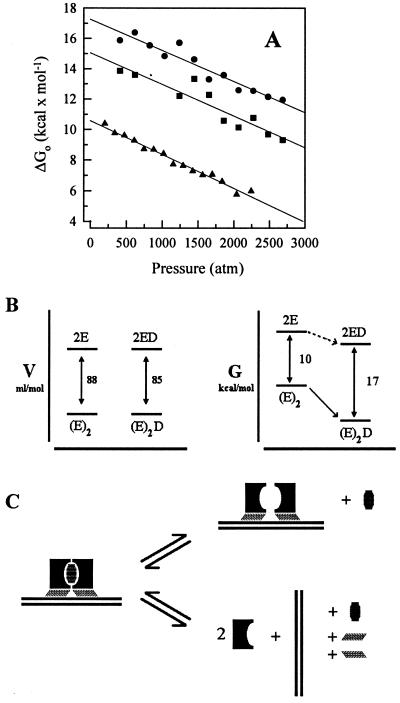
(A) Changes in E2c free energy as a function of pressure. Plot of ΔGo obtained from Fig. 4 (see text) vs. pressure for E2c–E2-DBS (●) and for E2c–poly(A-T) 18-mer (█). The extent of dissociation of E2c alone was calculated as described under Experimental Procedures (Eq. 7) for data from Fig. 1, converted to ΔGo values and plotted as a function of pressure (▴). (B) Volume vs. free energy diagram. Free energy levels of the relation between specific DNA binding and monomer association. D represents the double-stranded specific DNA; E represents an E2c monomer unit, which does not correspond necessarily to the folded monomer in the associated state; (E)2 represents the E2c in the dimer state; (E)2D represents the complex obtained from the association between one E2c dimer and a double-stranded DNA containing one DNA-binding site. (C) Scheme for subunit dissociation of E2c bound to DNA. In the upper situation, the monomers dissociate and remain bound. In the lower situation, there is dissociation from DNA as well. The hatched symbols correspond to void volumes.

