Fig. 4.
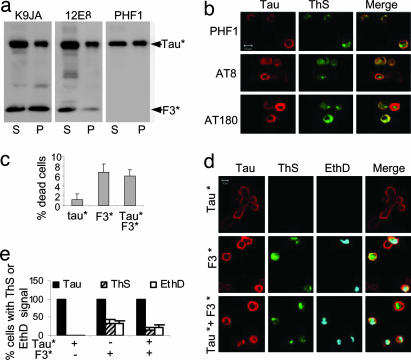
Aggregation and cell toxicity. (a and b) Aggregation and phosphorylation of Tau* in the presence of F3* in N2a cells. (a) Blot analysis of aggregation of full-length Tau* induced by F3*, using pan-tau antibody K9JA (Left) or phosphorylation-dependent antibodies 12E8 (Center) and PHF1 (Right). Note that phosporylation occurs both in supernatant and pellet and at different sites because of the activity of different kinases (e.g., MARK, GSK-3β). (b) Phosphorylation and aggregation of full-length Tau* induced by F3* in N2a cells, demonstrated by ThS staining. (Left) Tau expression monitored by immunolabeling with phosphorylation-dependent antibodies PHF1, AT8, or AT180 and Cy5 secondary antibody. (Center) Aggregates monitored by staining with ThS. (Right) Merged images. (c–e) Cell toxicity of tau aggregation. N2a cells transfected with tau construct F3*, Tau*, or cotransfected with F3* plus Tau* were induced for 2 days. (c) LDH release measured as an indicator of cell death, calculated as the percent of total LDH (media plus lysates). (Left) N2a cells expressing Tau*. (Center) F3*. (Right) Tau*+F3*. Note that expression of F3* alone or coexpression of F3* and Tau* strongly increases toxicity. (d) Cell death monitored by nuclear staining with EthD. Tau expression determined by immunolabeling with antibody K9JA (red), tau aggregation by ThS staining (green), and cell death by EthD staining (cyan). Note that cell death (blue) occurs preferentially in cells with aggregates (green). (e) Quantitation of ThS- or EthD-positive cells, showing that aggregation (induced by F3*) correlates with toxicity.

