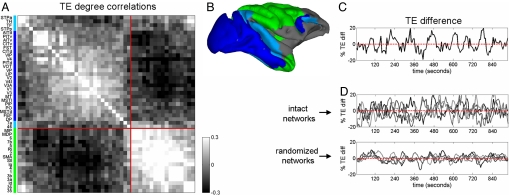
Fig. 3.
Anticorrelated functional clusters. (A) Degree correlation matrix capturing cross-regional correlations in gains and losses of thresholded functional connections. Matrix represents an average over four 960,000 time step (960-sec) runs, sampled as in Fig. 2 C and D. Cluster analysis yields two main clusters (blue, occipitotemporal; green, parietofrontal). (B) Anatomical location of main clusters in Caret coordinates (51). Areas intermediate in terms of degree correlations are shaded in light blue (areas STPa, STPp, TH, TF, 7a, and 46). (C) Difference in the mean within-cluster TE over time (for the same run shown in Fig. 2 C and D), expressed as percentage of mean signal. (D) TE difference profiles for four runs using intact (Fig. 1A) corticocortical connections (Upper), and four runs carried out in randomized networks preserving in- and out-degree of each node (Lower). Cluster analysis was performed on degree correlation matrices for each separate run to obtain two main clusters. Clusters were then used to calculate differences in mean TE. Standard deviations, expressed as percent baseline TE, are significantly different (two-tailed t test, P < 0.005) for the two groups.

