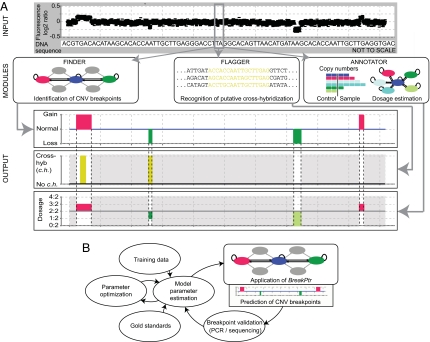
Fig. 2.
Overview of BreakPtr and its parameter optimization procedure. (A) Data from HighRes-CGH experiments are statistically integrated with nucleotide sequence signatures. Finder fine-maps CNV breakpoints. The subsequently implemented Annotator provides information in terms of copy number ratios, and Flagger identifies putative cross-hybridization for regions for which Finder has predicted CNVs (i.e., regions colored in light gray are disregarded). (HighRes-CGH signals shown in the figure do not correspond to original data but were generated for visualization purposes.) (B) Parameter optimization. Training data and gold standards are used to estimate initial parameters. Parameters are then optimized by using an EM-based algorithm (25). Finally, CNV breakpoints are predicted, and sequenced. A new round of parameter estimation is initiated subsequently by using further knowledge from validated breakpoints.

