
Figure 2.
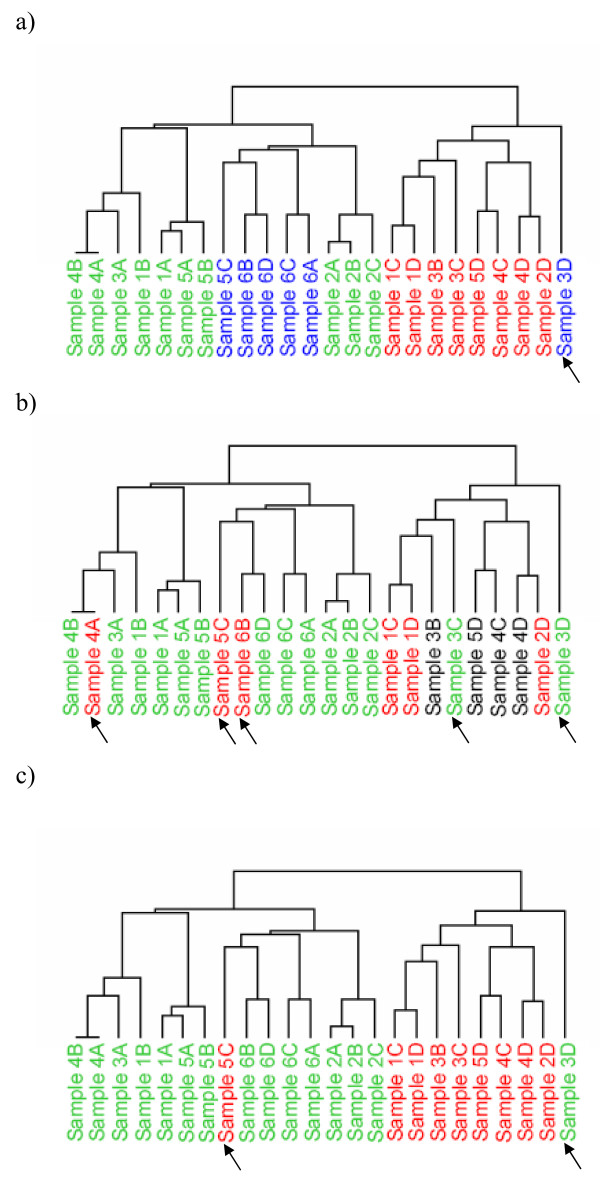
Unsupervised hierarchical clustering. Unsupervised hierarchical clustering was used to assess which samples clustered together based on their gene expression profiles. A. Clustering according to the Manual evaluation method; green = good, blue = partly degraded, red = degraded. B. Clustering according to the Ratio method; green = ratio ≥ 0.65 (i.e. good), red = ratio < 0.65 (i.e. degraded), and black = N/A (i.e. not available). C. Clustering according to the RIN method; green = RIN ≥ 6 and red = RIN < 6. Arrows indicate samples clustering in an unexpected manner, according to the respective methods.