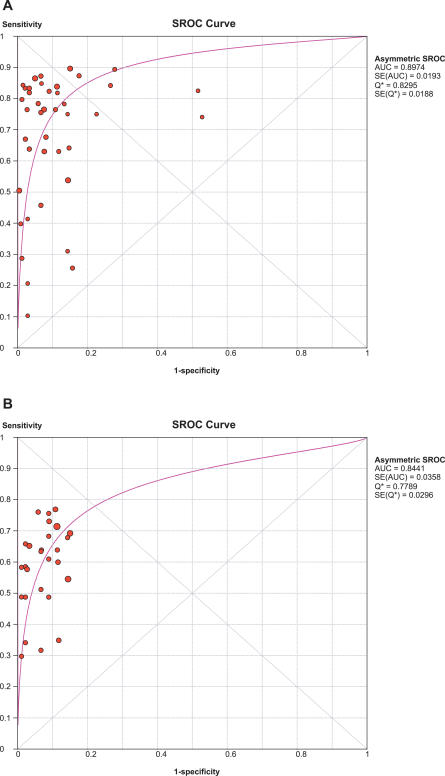
Figure 5. SROC Curve of Commercial Tests for the Diagnosis of Pulmonary TB.
(A) Smear microscopy–positive patients; (B) smear microscopy–negative patients. Each solid circle represents an individual study in the meta-analysis. The curve is the regression line that summarizes the overall diagnostic accuracy. SE (AUC), standard error of AUC; Q*, an index defined by the point on the SROC curve where the sensitivity and specificity are equal; SE (Q*), standard error of Q* index.

