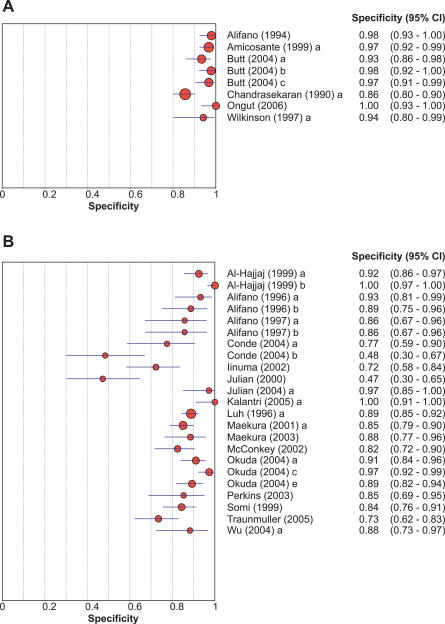
Figure 7. Specificity Estimates of Commercial Tests.
(A) Healthy control participants; (B) patients with nontuberculous respiratory disease. Studies using identical comparison groups appear only once. The circles and lines represent the point estimates and 95% CIs, respectively. The size of the circle indicates the study size.
doi:10.1371/journal.pmed.0040202.g007

