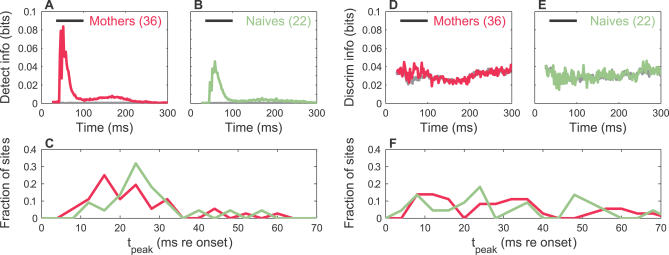
Figure 12. Detection and Discrimination Information for a Noncommunicative Sound Ensemble (Frequency-Halved Pup Calls).
(A) Average time course of detection information in mothers for all sites where this ensemble was presented. Both the measured (magenta) and randomized (gray) information are shown.
(B) Average time course of detection information in naïve females for all sites where this ensemble was presented. Both the measured (sage) and randomized (gray) information are shown. The information peak (above the mean randomized information) for mothers was 1.5× larger than that for naïve females, irrespective of whether all sites or only those with information z-scores exceeding z c were used.
(C) Histogram of peak detection information times (4-ms bins, relative to stimulus onset) for all sites is presented. The distribution for mothers was not significantly different from that of naïve females (two-sample KS test, n.s.), neither were their medians (two-sided rank sum test, n.s.), nor their means (two-sample t-test, n.s.).
(D) Average time course of discrimination information in mothers for sites with significant information is presented. Both the measured (magenta) and randomized (gray) information are shown.
(E) Average time course of discrimination information in naïve females for sites with significant information is presented. Both the measured (sage) and randomized (gray) information are shown.
(F) Histogram of peak discrimination information times (4-ms bins, relative to stimulus onset), for all sites. The distribution for mothers was not significantly different from that of naïve females (two-sample KS test, n.s.), neither were their medians (two-sided rank sum test, n.s.), nor their means (two-sample t-test, n.s.).

