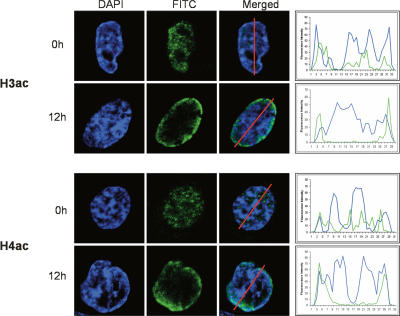
Figure 6.
Butyrate-mediated increase in total levels of acetylated histones preferentially occurs at the nuclear periphery. HepG2 cells were either untreated (0 h) or treated with 5 mM Na-butyrate for 12 h, and immunostaining assays were performed under both conditions using antibodies against H3ac (top) and H4ac (bottom) and secondary antibody coupled to FITC. From left to right are presented the staining patterns observed for DAPI in blue, FITC in green, and when both stainings are merged. The graphs to the right represent the signal quantification obtained for both DAPI and FITC along the red line drawn in the merged picture. The images represent the overall picture emerging from two biological replicates (Supplemental Fig. 3).

