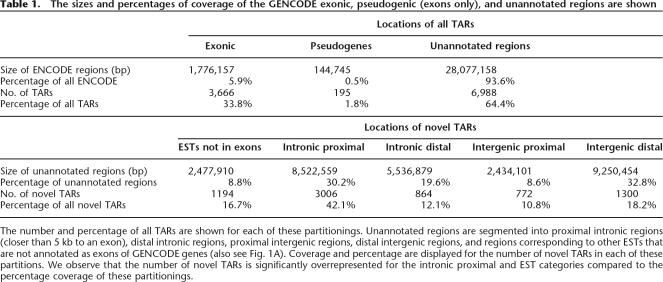
Table 1.
The sizes and percentages of coverage of the GENCODE exonic, pseudogenic (exons only), and unannotated regions are shown
The number and percentage of all TARs are shown for each of these partitionings. Unannotated regions are segmented into proximal intronic regions (closer than 5 kb to an exon), distal intronic regions, proximal intergenic regions, distal intergenic regions, and regions corresponding to other ESTs that are not annotated as exons of GENCODE genes (also see Fig. 1A). Coverage and percentage are displayed for the number of novel TARs in each of these partitions. We observe that the number of novel TARs is significantly overrepresented for the intronic proximal and EST categories compared to the percentage coverage of these partitionings.

