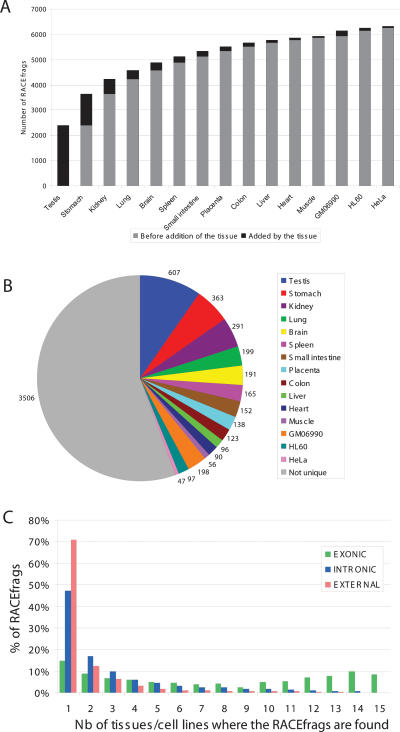
Figure 2.
A large proportion of RACEfrags are tissue-specific. (A) Cumulative number of RACEfrags identified in the 12 tissues and three cell lines; (B) numbers of RACEfrags specific to a single tissue; (C) proportion of exonic (green), intronic (blue), and external (orange) RACEfrags identified by one, two, three, or more tissues.

