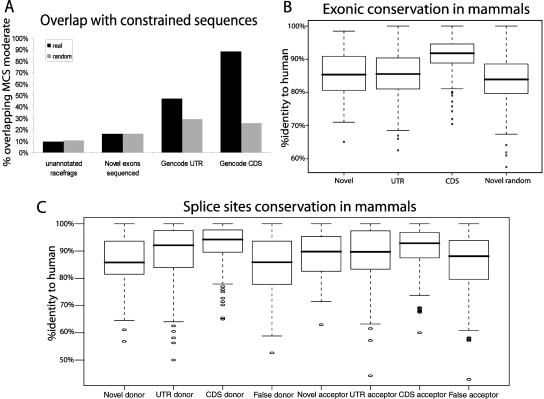
Figure 5.
Evolutionary conservation of RACEfrags. (A) Overlap of four data sets with constrained sequences. For each dataset, the percentage of projected (black) and random objects (gray; same sizes as real objects but randomly distributed in nonrepeated regions and unannotated for RACEfrags or novel exons) overlapping MCS (Multi-species Conserved Sequences)-constrained sequences by at least one nucleotide are represented on the Y-axis. Please note that GENCODE UTR and GENCODE CDS show an overlap with MCS significantly greater than random sequences. (B) Exonic conservation in mammals. For each dataset, a boxplot depicting the distribution of nucleotide conservation scores is shown. Conservation is computed as the percent identity to the human sequence for the entire length of the feature. The heavy black line marks the median score, the box contains the second and third quartiles, and whiskers mark the fifth and ninety-fifth percentiles. Novel random features are randomly chosen from unannotated nonrepetitive regions that exhibit the same size distribution as novel exons. For CDS features, a random nonredundant subset of GENCODE-annotated known coding exons was used. The CDS exons are significantly more conserved than the other features. Note that the novel sequenced exons and GENCODE UTR exons are significantly more conserved than random sequences (Novel random). (C) Splice sites conservation in mammals. For each data set, donor sequences (−2 to +6 with respect to the 5′ splice junction) and acceptor sequences (−6 to +2 with respect to the 3′ splice junction) were scored for conservation to the human splice site sequence. Boxplots were produced as in B. False splice sites were picked at random from the set of all GT or AG dinucleotides in ENCODE regions that do not overlap GENCODE-annotated exons or repeats. UTR and CDS donors and CDS acceptors are significantly more conserved than false splice sites (random GT or AG). Novel splice sites do not exhibit elevated conservation over background.

