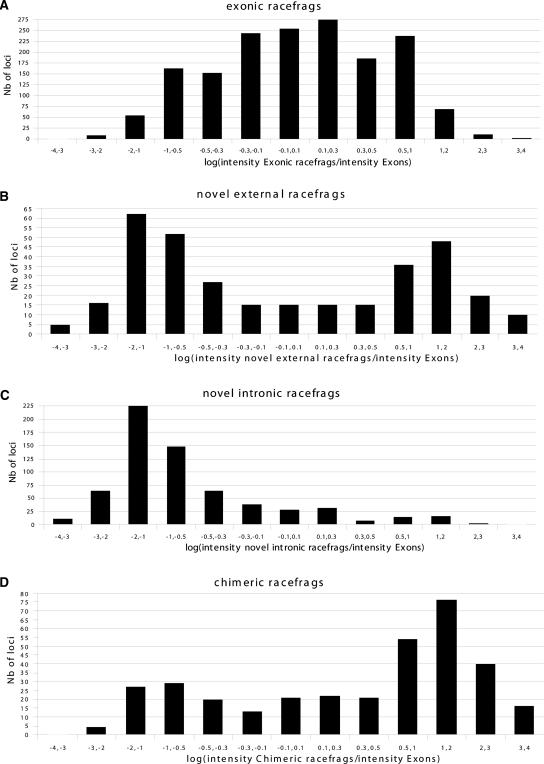
Figure 7.
Expression levels of RACEfrags. Distribution of ratios of intensity signals measured for probes overlapping different subsets of RACEfrags: exonic (A), novel external (B), novel intronic (C), and chimeric (D). The expression levels in the different sets were calculated by averaging the median intensities of positive probes in each RACEfrags/exons among all the exons/RACEfrags in the set. The ratios are calculated as the intensity level obtained in the considered set of RACEfrags divided by the intensity level obtained for exons from the target locus. The bins on the X-axis represent the log of the ratios (logs between −0.3 and 0.3 correspond to ratios between 0.5- and twofold).

