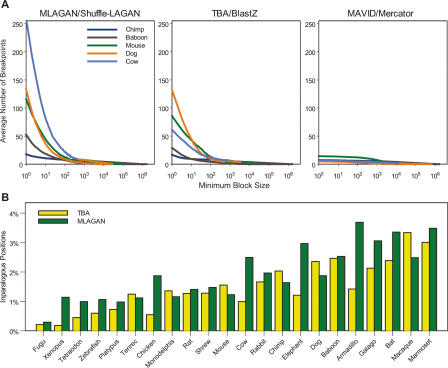
Figure 3.
Rearrangements and duplications inferred by the alignments. (A) Number of rearrangement breakpoints in the ENCODE regions as a function of minimum block size, determined by three alignment methods. For each species, the average number of breakpoints over all regions (Y-axis) was calculated for all minimum block sizes (in base pairs; X-axis). The species shown are chimp (dark blue), baboon (brown), mouse (green), dog (orange), and cow (light blue). For each minimum block size, the number of breakpoints in a given region was determined after removing blocks in order of increasing size and joining consistent blocks until no block had size less than the minimum (see Methods). (B) Duplicated human nucleotide positions in the ENCODE regions. The fraction of ENCODE positions that are inparalogous to one another relative to a given species is plotted for each species, as determined by TBA (yellow) and MLAGAN (green). Colobus Monkey, Dusky Titi, Mouse Lemur, and Owl Monkey are not shown because sequence from these species was only obtained for one region (ENm001).

