Figure 5.
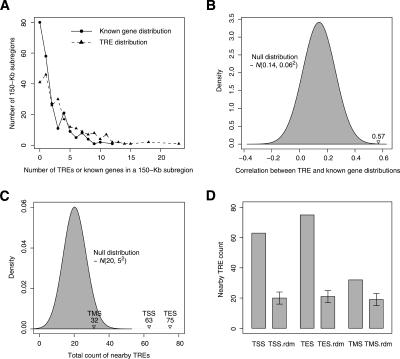
Relationship between the TRE and the known gene distributions in ENCODE regions. (A) The distributions of TREs and known genes in ENCODE regions; 150-kb genomic subregions were used. (B) The correlation between the numbers of TREs and known genes in each 150-kb subregion compared with its null distribution, N(0.14, 0.062). (C) The counts of actual TREs within a 1-kb window of gene TSSs, TESs, and TMSs, compared with their corresponding null distributions. All three null distributions are Gaussian-like and almost identical to N(20, 52), which is shown in the plot. (D) Comparison of the actual counts with their corresponding random background, which is depicted as the mean and ±1 SD of each null distribution.

