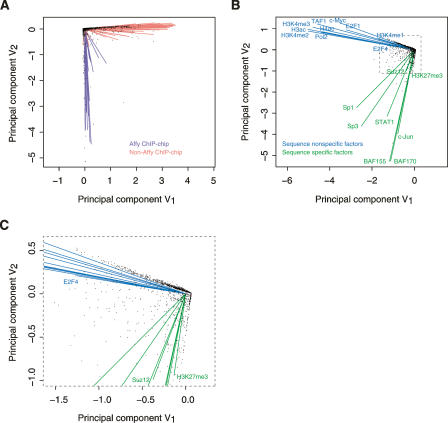
Figure 6.
Interrelationship of ChIP–chip experiments and transcription factors with genomic bins. (A) Biplot of 105 original ChIP–chip experiments with 5996 5-kb nonoverlapping genomic bins. Lines represent ChIP–chip experiments, and points indicate genomic bins. (B) Biplot of 18 transcription factors with the same set of genomic bins as in A. Lines represent transcription factors, and points indicate genomic bins. The TREs of each of these 18 transcription factors were merged from the 64 non-Affy ChIP–chip experimental results on a factor basis by taking the union of all TRE lists of each factor. (C) Details of the point-dense region of B inside the box with dashed border. The signs of both coordinates of a point (or the end point of a line) in a biplot are somewhat arbitrary because the data matrix is column-normalized prior to the construction of the plot. Since the scale only reflects the magnitude of the original data, it is not significant in terms of interpreting a biplot either.

