Figure 2.
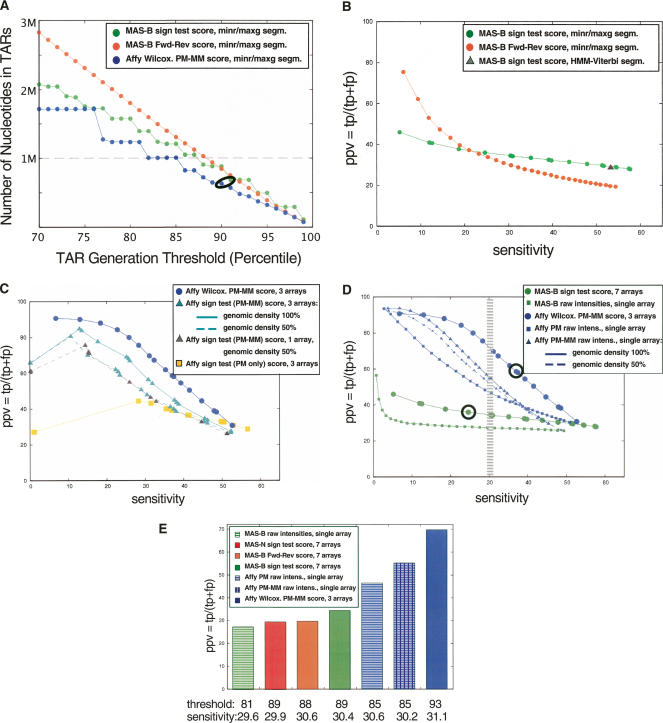
(A) Number of nucleotides in placental TARs as a function of segmentation threshold (percentiles). TARs were generated with the maxgap/minrun algorithm based on the scored hybridization intensity data using a genomic window and technical replicates: MAS-B scored with the standard sign test (green); MAS Fwd-Rev scoring using reverse strand as “mismatch” (orange), pseudomedian; Affymetrix scored using pseudomedian from PM-MM (blue). The data points corresponding to the data sets used in the Comparison section are circled: Thresholds are 90th percentile for Affy and 91st percentile for MAS-B (sign test scoring). (x-axis) The percentile score threshold for calling a probe “positive.” (y-axis) The number of nucleotides in TARs (in megabase pairs). The dashed line corresponds to the number of nucleotides in exons in the analyzed region (1,001,238 nt). (B) Positive predictive value (PPV) versus sensitivity for three different ways of scoring and segmenting the MAS-B data, varying the segmentation threshold from 70th percentile (to the right in the figure) to 99th percentile (to the left) for the MAS-B set scored with the standard sign test (green); scored using reverse strand as “mismatch” (Fwd-Rev scoring, orange); and the result from HMM segmentation (Viterbi decoding) of sign test-scored data (gray triangle). Sensitivity (x-axis), defined as the percentage of bases in GENCODE exonic regions that are covered by a TAR. PPV (y-axis), defined as the percentage of bases in the TARs that overlap with a GENCODE exonic region. (C) PPV versus sensitivity for two different ways of scoring the placenta Affy data, using three replicates (six array features) unless otherwise stated: Wilcoxon signed rank test (blue circles), and standard sign test (using PM–MM values: cyan triangles; using PM-only values: yellow squares). The result from reducing the genomic density of the Affy array to 50% (i.e., removing the data from every second probe) is also shown using PM–MM values (three replicates: cyan triangles, dashed line; single replicate only: gray triangles, dashed line). (D) PPV versus sensitivity for MAS-B and Affy placenta data, varying the segmentation threshold from the 70th percentile (right) to the 99th percentile (left). The average results of TARs generated from raw intensities from single arrays for Affy (PM only [blue squares], and PM–MM [blue triangles; solid line actual genomic density, dashed line 50% genomic density]) and MAS-B (green squares) are plotted, as well as scored results for Affy (blue circles) and MAS-B (green circles). Sensitivity (x-axis), and PPV (y-axis), defined as above. The data points corresponding to the data sets used in the Comparison section are circled. The hatched area marks where a sensitivity of 30% is achieved for the various sets. (E) PPV for placental TAR sets when choosing a segmentation threshold that yields ∼30% sensitivity (hatched area in B). Note that the actual sensitivity varies slightly between the sets.

