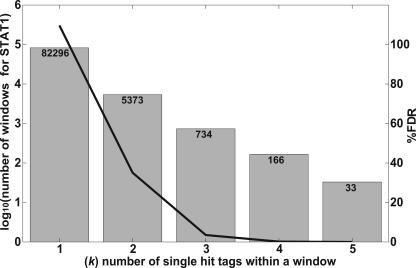
Figure 2.
Determination of optimal window size used for target identification. Windows of different sizes (300, 500, 1000, and 2000 bp) were scanned across the entire genome. For each window, we defined k as the number of single-hit tags found within the window. The number of windows observed for a given k in the STAGE tag data was compared with the number observed in random simulated data. A window size of 500 bp gave an optimal separation between random and real data. Data shown is for a window size of 500 bp. The gray bars indicate log10 of the number of windows detected based on STAT1 tags, with actual numbers of windows at each k listed at the top of the column. The black line shows the decline in the false discovery rate (FDR) with increasing k. The FDR was calculated as the ratio of the number of windows found in the random simulated library to the number of windows detected in the experimental STAT1 library. The raw data for other window sizes is included in Supplemental Table 1.

