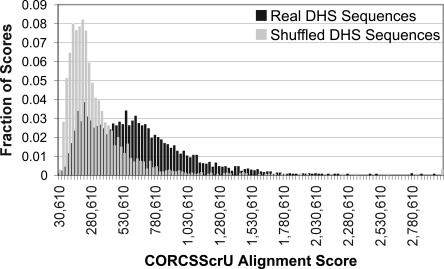
Figure 1.
Histogram of alignment scores of shuffled versus DHS sequences. The CORCSScrU program was run 3204 times until convergence, using either real or shuffled sequences from the MPSS DHS data set. The window size was preset to 12. The resulting alignment scores were binned and are represented here as two histograms. The alignment scores for the real sequences are generally higher than those from the shuffled sequences. A Kolmogorov-Smirnov test indicates that these two distributions are significantly different (p = 10−17).

